The data analysis software in GeoMx DSP supports easy visualization and interpretation of data. High-resolution images can be displayed alongside quantitative profiling data, allowing interaction with either dataset in real time.

GeoMx® Digital Spatial Profiler (DSP)
The NanoString GeoMx® DSP technology builds upon the highly robust nCounter® digital barcode technology, providing morphological context and high-plex gene expression profiling from prepared slide samples. The technology uses software that offers tremendous flexibility when selecting a region-of-interest strategy (geometric, segmentation, cell-type specific, contour, gridded) to visualize spatial architecture and analyze multiple biomarkers within a tissue sample.
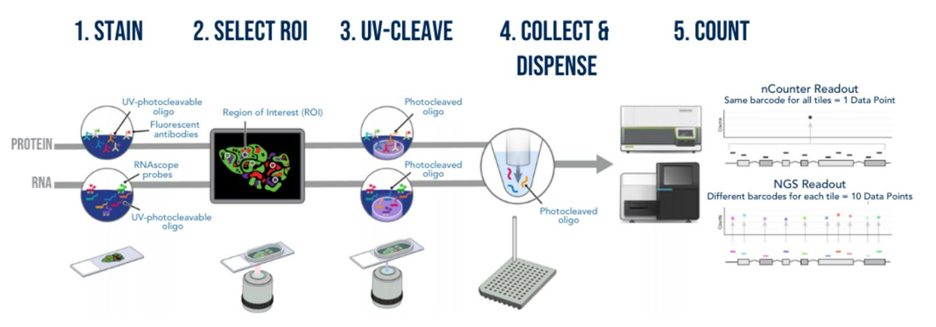
How does GeoMx DSP work?
The assay relies on RNA probes coupled with photocleavable oligonucleotide tags. After hybridization of probes to slide-mounted formalin-fixed paraffin-embedded (FFPE) tissue sections, the oligonucleotide tags are released from discrete, chosen regions of the tissue via UV exposure. Released tags are quantitated using RNAseq or a standard nCounter assay, and counts are mapped back to tissue location, yielding a spatially resolved digital profile of analyte abundance.1
Applications of GeoMx DSP2
- Discover biomarkers that predict therapeutic response
- Profile distinct regions or cell types within the tumor microenvironment
- Uncover the mechanism of action of a drug
- Explore which genes are affected by a drug in specific components of a tissue
- Reveal molecular subtypes for diseases
- Understand disease mechanisms and progression
- Study preclinical models
Advantages of GeoMx DSP
Spatial resolution
Provides high-resolution spatial information, allowing researchers to analyze gene expression patterns at the cellular and subcellular levels within complex tissues. This spatial context is critical in understanding the functional organization and interactions between different cell types.
Cellular heterogeneity
Unlike bulk RNA analysis, GeoMx DSP enables the identification and profiling of individual cell types within a tissue sample. This is particularly valuable in heterogeneous tissues like tumors, where understanding the specific expression patterns of different cell populations is essential for precision medicine and biomarker discovery.
Tissue architecture insights
Offers a detailed map of gene expression within the tissue architecture, providing insights into the organization and structure of biological samples. This information is crucial for uncovering spatial relationships and understanding how gene expression varies across different regions of a tissue.
Biomarker discovery
The spatially resolved approach of GeoMx DSP enhances the discovery of spatially associated biomarkers, which may be overlooked in bulk RNA analysis. This capability is essential for identifying potential therapeutic targets and diagnostic markers for diseases.
Single-cell analysis
Allows for single-cell resolution, enabling the study of individual cells' unique gene expression profiles. This level of granularity is particularly valuable in unraveling the complexity of biological systems and can lead to more precise and targeted therapeutic interventions.
Multiplexed analysis
Supports multiplexed analysis, allowing the simultaneous measurement of up to 21,000+ RNA targets. This efficiency not only saves time and resources but also provides a more comprehensive view of the molecular landscape, facilitating a holistic understanding of gene expression patterns.
Compatibility with existing technologies
Designed to be compatible with other molecular analysis techniques, including traditional RNA sequencing. The seamless integration allows researchers to combine spatial information with high-throughput genomic data, providing a more comprehensive and complementary analysis.
Customizable panels
Researchers can design custom panels to target specific genes or pathways of interest, tailoring GeoMx DSP experiments to meet the unique requirements of their studies. This flexibility enhances the versatility of the platform for a wide range of research applications.
Clinical relevance
Ability to analyze clinical samples, including FFPE tissues, makes it highly relevant for translational research and clinical studies. This feature extends the potential impact of GeoMx DSP in the development of diagnostic tools and personalized medicine.
Data visualization tools
The platform is equipped with advanced data visualization tools that facilitate the interpretation of spatial gene expression data. Researchers can create detailed maps and visual representations that aid the intuitive and comprehensive analysis of complex biological samples.
Explore tissue heterogeneity through spatial transcriptomic profiling
Learn more about the kinds of results we can produce with the GeoMx® DSP technology by reading our spotlight Explore tissue heterogeneity through spatial transcriptomic profiling.
GeoMx DSP FAQs
-
Why should I use GeoMx DSP instead of bulk whole-tissue RNASeq or nCounter?
GeoMx DSP offers distinct advantages over traditional bulk, whole-tissue RNA analysis, revolutionizing the field of spatial genomics. Unlike bulk RNA analysis, GeoMx DSP enables researchers to dissect complex biological tissues at a spatial resolution, providing a detailed map of gene expression within the context of the tissue architecture. This spatially resolved approach allows for a more precise understanding of the cellular heterogeneity and interactions within a sample, offering insights into the spatial organization of gene expression patterns. By preserving the spatial context, GeoMx DSP enables the identification of cell-specific expression profiles and spatially associated biomarkers that would be overlooked in bulk RNA analysis. Additionally, GeoMx DSP is particularly valuable in studying heterogeneous samples, such as tumors, where spatial information is crucial for deciphering the intricate molecular landscape. Overall, GeoMx DSP represents a powerful advancement in genomics research, offering a more comprehensive and nuanced understanding of biological systems compared to conventional bulk RNA analysis.
-
Why should I use GeoMx® DSP instead of flow cytometry?
Flow cytometry is the gold standard method for analysis of immunotherapy-triggered effects on immune cells in the tumor. However, a limitation inherent in this assay is that flow cytometry is unable to differentiate activated immune cells in different compartments within the tumor microenvironment (TME). Due to the heterogeneous nature of the TME, it is important to visualize and examine immune cells that are in close contact with target tumor cells. Immunomodulatory responses in the immune cells contacting tumor cells cannot be elucidated using flow cytometry. With GeoMx DSP, we can select for specific cell types in regions of interest (ROI) that are identified using morphological markers and analyze ROI- and cell-specific immunomodulatory responses.
-
What types of cells or tumor microenvironment components can we analyze in the tissue using GeoMx DSP?
- Tumor cells
- Cancer stem cells
- Metastatic cancer cells
- Quiescent cancer cells
- High PanCK-expressing cancer cells
- Low PanCK-expressing cancer cells
- Apoptotic cancer cells
- Necrotic cancer cells
- Immune cells
- T cells: CD4+, CD8+ and Tregs
- CAR T cells
- B Cells: Bregs
- NK cells
- Myeloid-derived suppressor cells
- Tumor-associated macrophages: M1, M2
- Tumor-associated neutrophils: N1, N2
- Dendritic cells
- Stromal cells
- Tumor endothelial cells
- Pericytes
- Cancer-associated fibroblasts
- Mesenchymal stem cells
- Tumor-associated adipocytes
- Stellate cells
- Blood vessels
- Lymph vessels
- Normal host tissues/cells
- Extracellular matrix
- Exosomes
- Tumor cells
-
What types of samples can be used with GeoMx DSP?
They can be either FFPE tissues or FFPE slides. We can also prepare the slides if you are running your in vivo study with us.
-
What information do I need to provide to run a GeoMx DSP study with Labcorp?
- What host organism and tumor model organism will be used
- Number of slides to be processed and analyzed by the DSP system
- Morphology markers and target mRNA panel(s)
- Number of ROIs per slide
- How the ROIs will be chosen and drawn
- Whether ROIs will be segmented
- How much data analysis will be needed (can be decided at the end of the study)
-
What data can I analyze with only one slide from each group?
- Changes in specific genes can be further analyzed to:
- Find new biomarkers
- Determine how the treatment affected specific biomarkers
- Find new oncogenes or tumor suppressor genes
- Find drug targets
- Determine if/how the treatment affected specific target genes
- Changes in specific gene sets can be further analyzed to determine:
- How specific signaling pathways respond to treatment
- Which cell types respond to treatment
- How specific locations within the tumor microenvironment are affected by the treatment
- Which cellular/molecular components are involved in drug efficacy or failure
- Changes in specific genes can be further analyzed to:
References
- National Cancer Institute’s Center for Cancer Research. NanoString GeoMX Digital Spatial Profiler (DSP). https://genomics.ccr.cancer.gov/ncounter-geo-mx-digital-spatial-profiling/
- GeoMx® Digital Spatial Profiler. NanoString. https://nanostring.com/products/geomx-digital-spatial-profiler/geomx-dsp-overview/
Let's start a conversation
Let’s discuss how we can give your study an edge with spatial transcriptomic analysis.
Contact Us
Labcorp is a leading global life sciences company that includes contract research and developmental services to the pharmaceutical, medical technology, crop protection and chemical industries.