Author: Dan Saims, In Vitro Scientist II and Gunisha Arora, Medical and Scientific Writer
Date: March 2024
The GeoMx® Digital Spatial Profiler (DSP) is a unique spatial multiomic platform that non-destructively allows for absolute measurement of RNA in specific chosen tissue compartments and cell populations on FFPE slides, preserving the spatial/locational information of those targets.
The tumor microenvironment (TME) is complex and heterogeneous, consisting of immune cells, tumor cells, blood and lymph vessels, fibroblasts, endothelial cells, cytokines, extracellular vesicles and extracellular matrix. This complexity makes it important to visualize and examine specific cell types in specific compartments. With the goal of understanding and improving anti-tumor immune response in the TME, we used the GeoMx® DSP platform to examine the effects of anti-mPD-1 therapy on CD45+ immune cells and PanCK+ tumor cells within the TME of the subcutaneous (SC) MC38-NCI.TD1 murine colon carcinoma model.
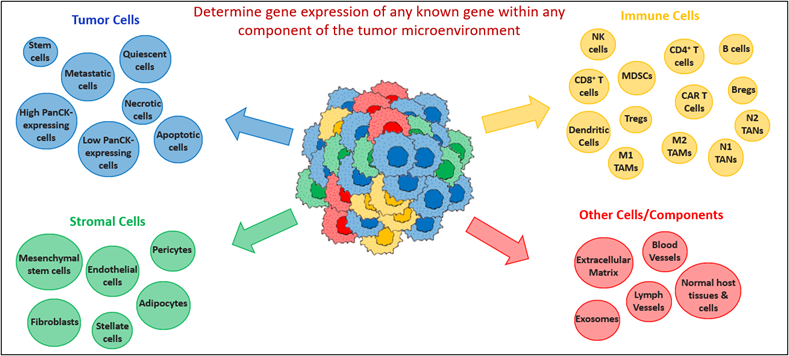
Figure 1. Graphic representing tumor heterogeneity and the different components of the tumor microenvironment that can be examined with the GeoMx® DSP platform.
Treatment of MC38-NCI.TD1 SC tumors with anti-mPD-1 antibody shows mild to moderate response in C57BL/6 mice, resulting in tumor growth delay.
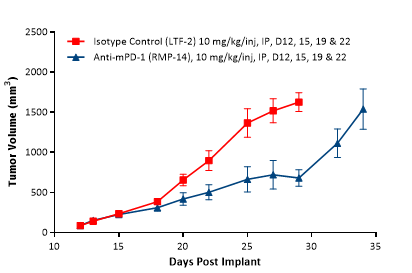
Figure 2. Mean tumor volume following treatment with anti-mPD-1 antibody versus isotype control antibody.
For whole transcriptome analysis of specific cell populations within treated and control MC38-NCI.TD1 tumor tissues, FFPE sections on slides were stained with morphological markers to identify the tumor cells (PanCK), immune cells (CD45), and all DNA containing cells (Syto13). Surprisingly, the MC38-NCI.TD1 tumor cells were found to express PanCK at different levels. To determine treatment-related and non-treatment-related gene expression changes between immune cells and the different types of tumor cells, regions of interest (ROIs) were drawn and segmented into the following areas of illumination (AOIs): PanCKHigh only = tumor cells far from any immune cells, PanCKHighCD45+ = tumor cells near immune cells, CD45+PanCKHigh = immune cells near high-PanCK-expressing tumor cells, and CD45+PanCKLow = immune cells near low-PanCK-expressing tumor cells.
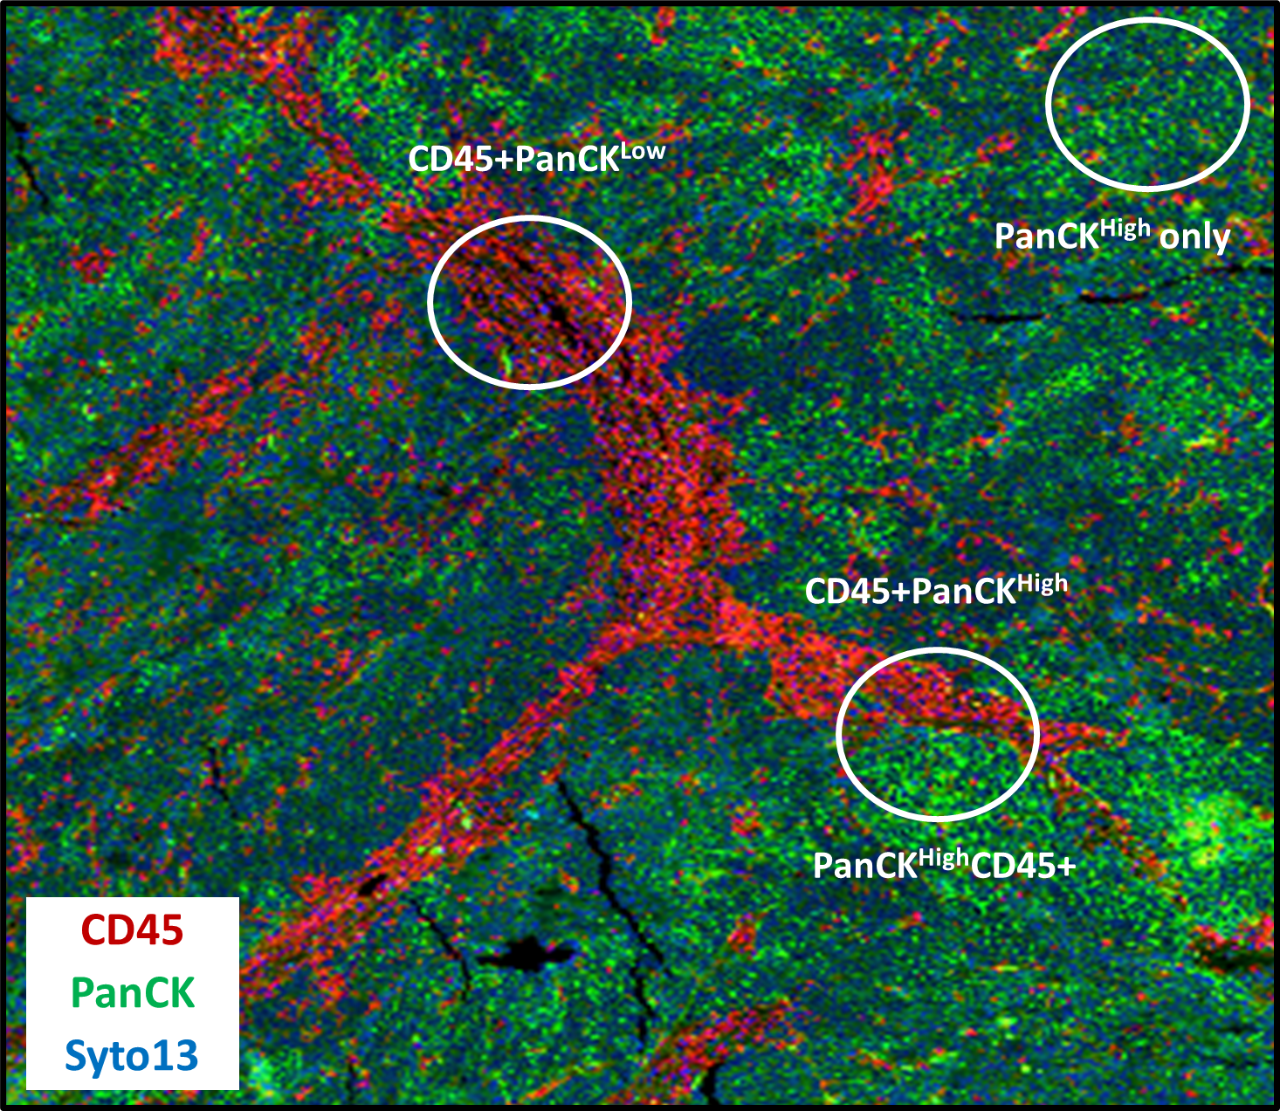
Figure 3. Morphology marker-stained MC38-NCI.TD1 tumor section demonstrating the ROI and segmentation strategy used for each of 12 slides (6 slides from the isotype control antibody treated group and 6 slides from the anti-mPD-1 antibody treated group). Four biological replicate AOIs of each type were examined per slide.
Our results demonstrated that, regardless of treatment, most of the transcriptomic modulation occurred within immune cells that were in proximity to high PanCK-expressing tumor cells (CD45+PanCKHigh). Most of the upregulated genes were associated with T cells and immune modulation.
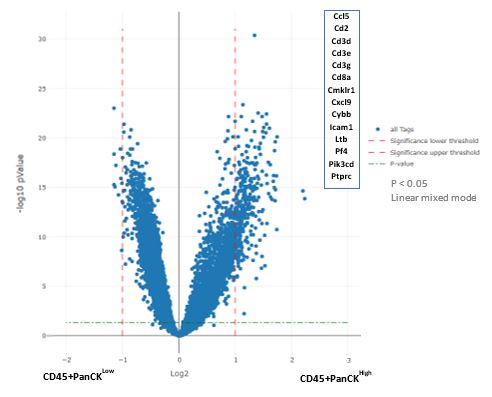
Figure 4. Volcano plot showing whole transcriptome changes of all mouse genes in CD45+PanCKHigh immune cells versus CD45+PanCKLow immune cells of MC38-NCI.TD1 tumors treated with isotype control antibody and anti-mPD-1 antibody (combined AOIs). Several of the upregulated genes in the CD45+PanCKHigh cell population are listed in the box.
With anti-mPD-1 antibody treatment, transcriptomic modulation of immune activation markers, cytokine signatures, and immune cell adhesion and migration pathway genes was much more prominent in the CD45+ immune cells that were in proximity to high-PanCK-expressing tumor cells (CD45+PanCKHigh) versus those in proximity to low-PanCK-expressing tumor cells (CD45+PanCKLow).
Isotype Control Antibody Group
Anti-mPD-1 Antibody Treated Group
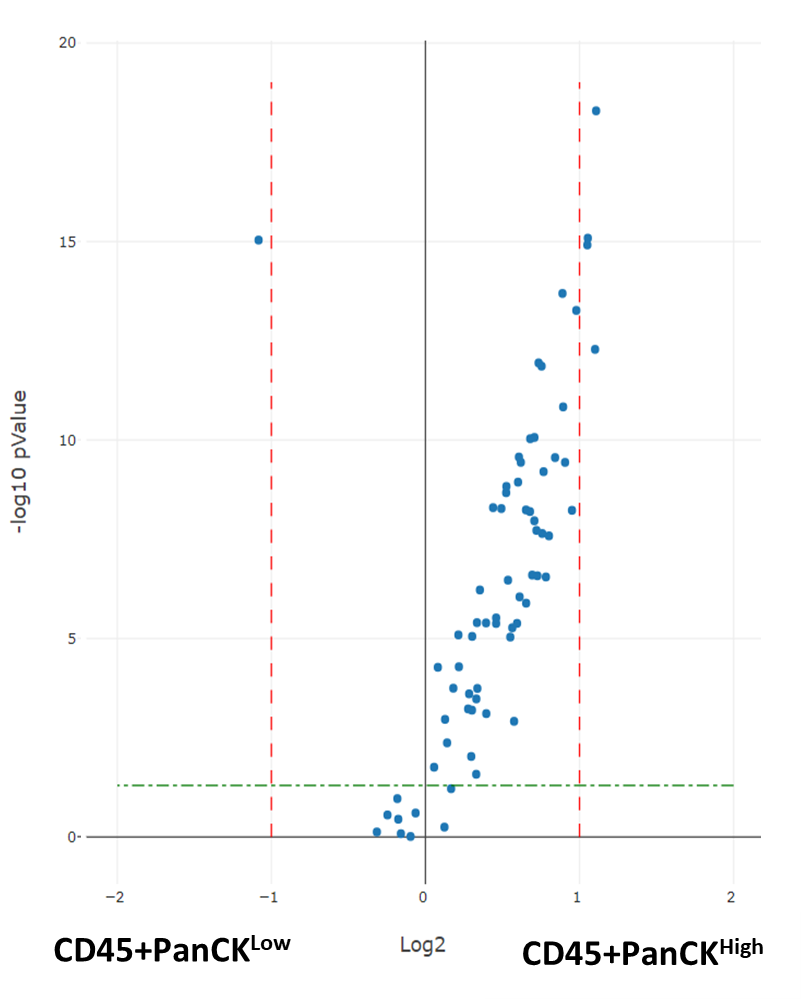
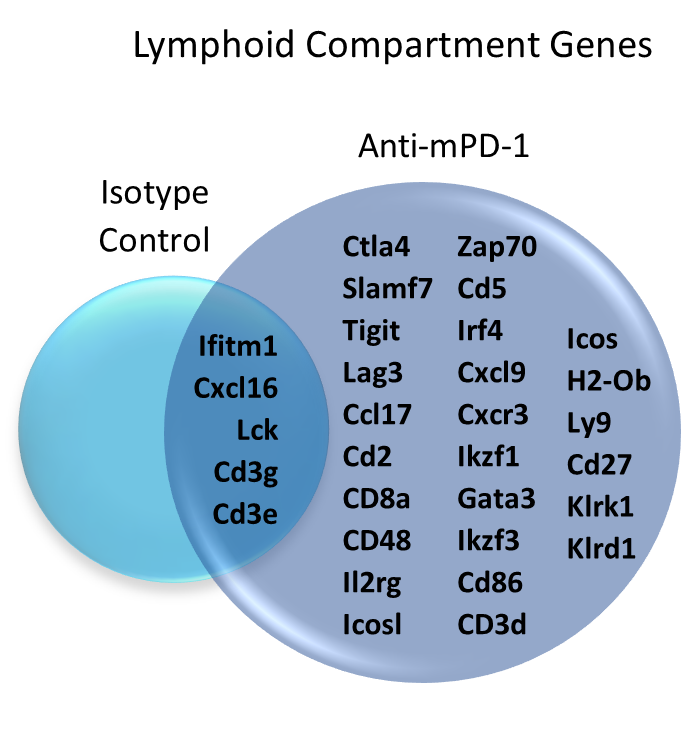
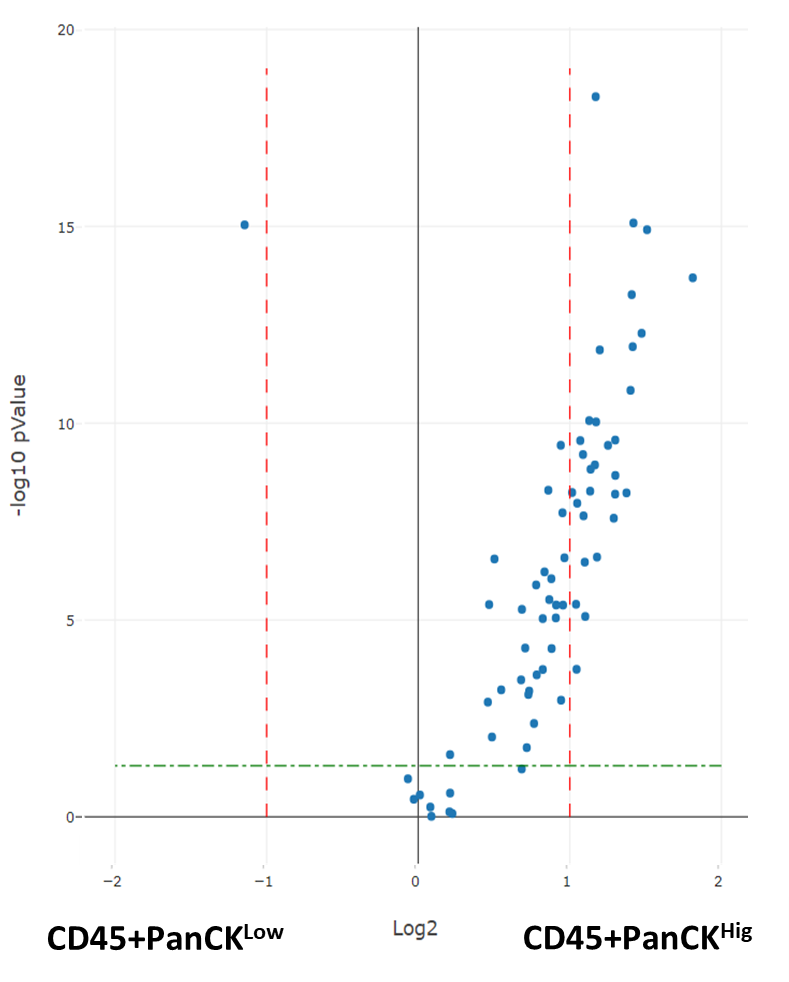
Figure 5. Volcano plots showing transcriptomic modulation of lymphoid compartment genes in CD45+PanCKHigh immune cells versus CD45+PanCKLow immune cells of MC38-NCI.TD1 tumors treated with isotype control antibody versus anti-mPD-1 antibody. Immune activation markers and cytokine signatures, upregulated in the CD45+PanCKHigh cell populations of both groups, are listed in the Venn diagram.
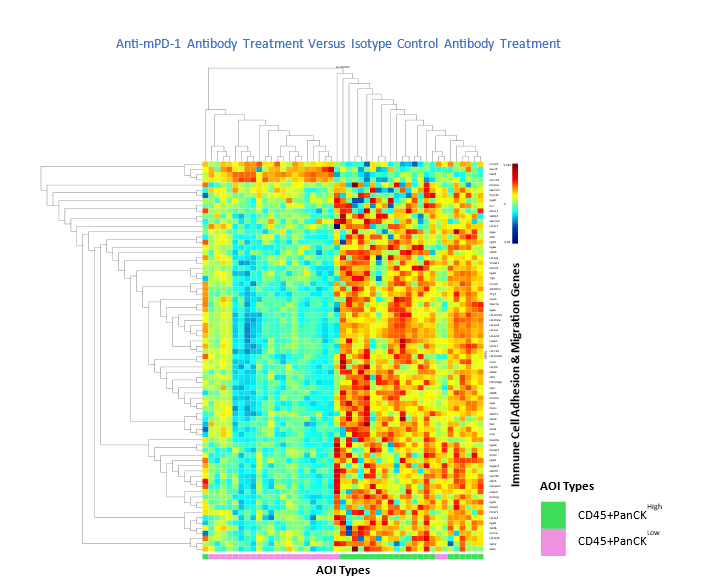
Figure 6. Heatmap and cluster analysis showing transcriptomic modulation of immune cell adhesion and migration pathway genes in CD45+PanCKHigh immune cells and CD45+PanCKLow immune cells of MC38-NCI.TD1 tumors when treated with anti-mPD-1 antibody compared with isotype control antibody. Red indicates upregulation with anti-mPD-1 antibody treatment; blue, downregulation.
In the tumor cell populations with anti-mPD-1 antibody treatment, transcriptomic upregulation of apoptosis and autophagy genes was more prominent in the high PanCK-expressing tumor cells that were in proximity to CD45+ immune cells (PanCKHighCD45+) versus those that were far from CD45+ immune cells (PanCKHigh Only).
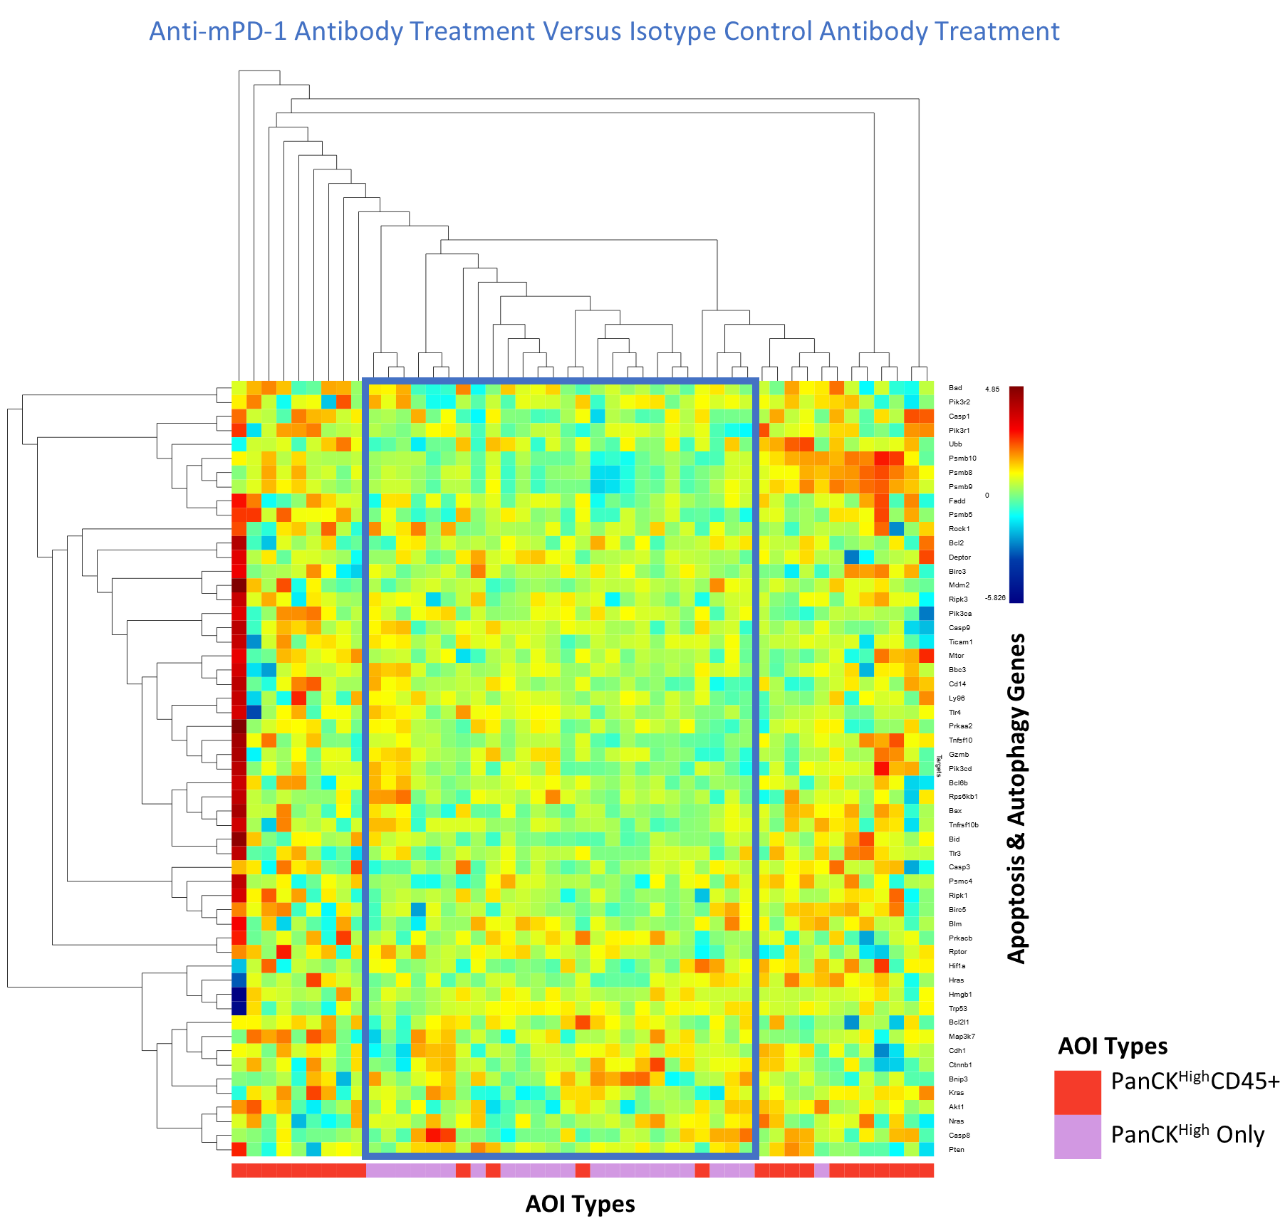
Figure 7. Heatmap and cluster analysis showing transcriptomic modulation of apoptosis and autophagy genes in PanCKHighCD45+ tumor cells and PanCKHigh Only tumor cells of MC38-NCI.TD1 tumors when treated with anti-mPD-1 antibody compared with isotype control antibody. Red indicates upregulation with anti-mPD-1 antibody treatment; blue, downregulation.
These data highlight the significance of incorporating spatial analysis into preclinical investigations with mouse tumor models, offering an intriguing platform to explore the dynamics between immune cells and tumor cells within the tumor microenvironment.
GeoMx® DSP offers distinct advantages over whole-tissue transcriptomics using nCounter® and immune cell subsets analyses using flow cytometry. It uniquely enables researchers to dissect heterogeneous tumors at a spatial resolution, providing a detailed map of the intricate molecular landscape. This spatially resolved approach allows for a more precise understanding of cellular interactions within a tissue sample and changes in spatially associated biomarkers that could be obscured using whole-tissue transcriptomics or flow cytometry. Moreover, the breadth and depth of data generated by the GeoMx® DSP is unparalleled with a coverage across 21,000+ mouse genes and identification of nuanced changes in specific cell types across different compartments of the TME.
We compared the expression of all 770 genes within the mouse PanCancer IO 360 panel as well as specific subsets of these genes using both whole tissue nCounter analysis and GeoMx® DSP spatial analysis in the SC MC38-NCI.TD1 murine colon carcinoma model. More genes were found to be significantly regulated in specific cell populations using GeoMx® DSP analysis compared to nCounter whole tissue analysis.
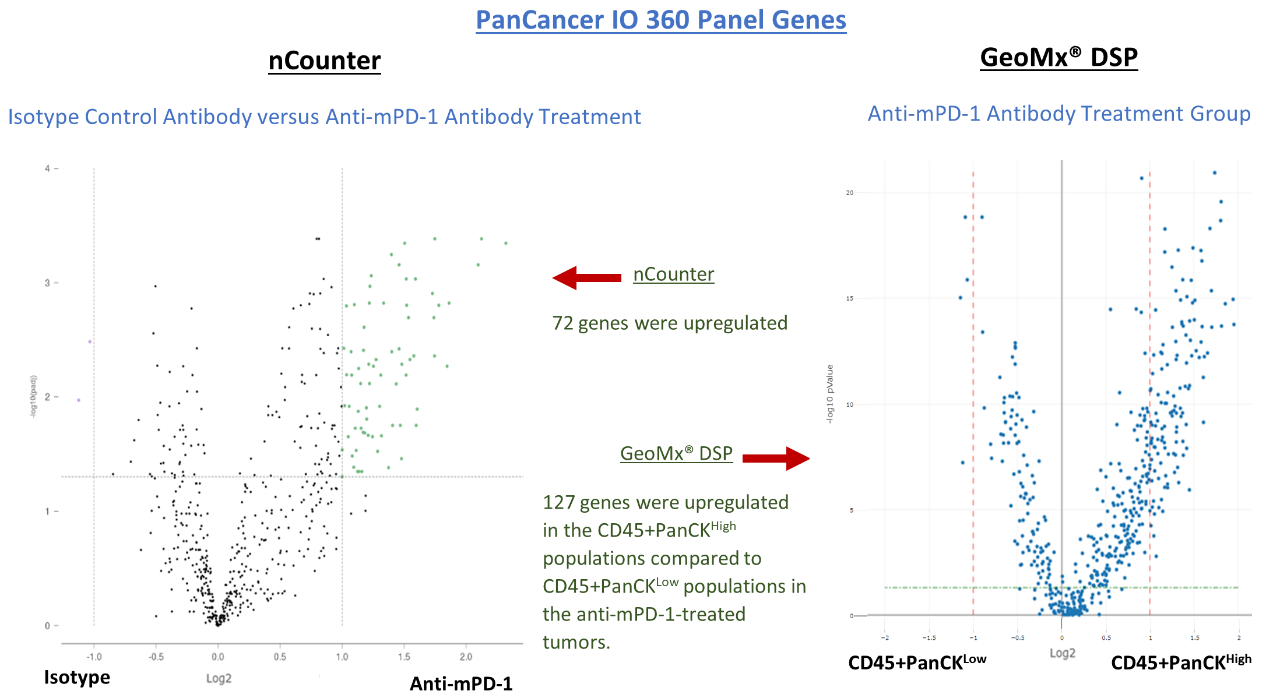
Figure 8. Volcano plots showing transcriptomic modulation of the PanCancer IO 360 genes that passed QC. On the left: whole tissue nCounter analysis comparing gene expression in isotype control antibody versus anti-mPD-1 antibody treated MC38-NCI.TD1 tumors. On the right: GeoMx® DSP analysis comparing gene expression in CD45+PanCKHigh immune cells versus CD45+PanCKLow immune cells in anti-mPD-1 antibody treated MC38-NCI.TD1 tumors. Regulated genes only include significant genes (p ≤ 0.5) that showed ≥ 2-fold change.
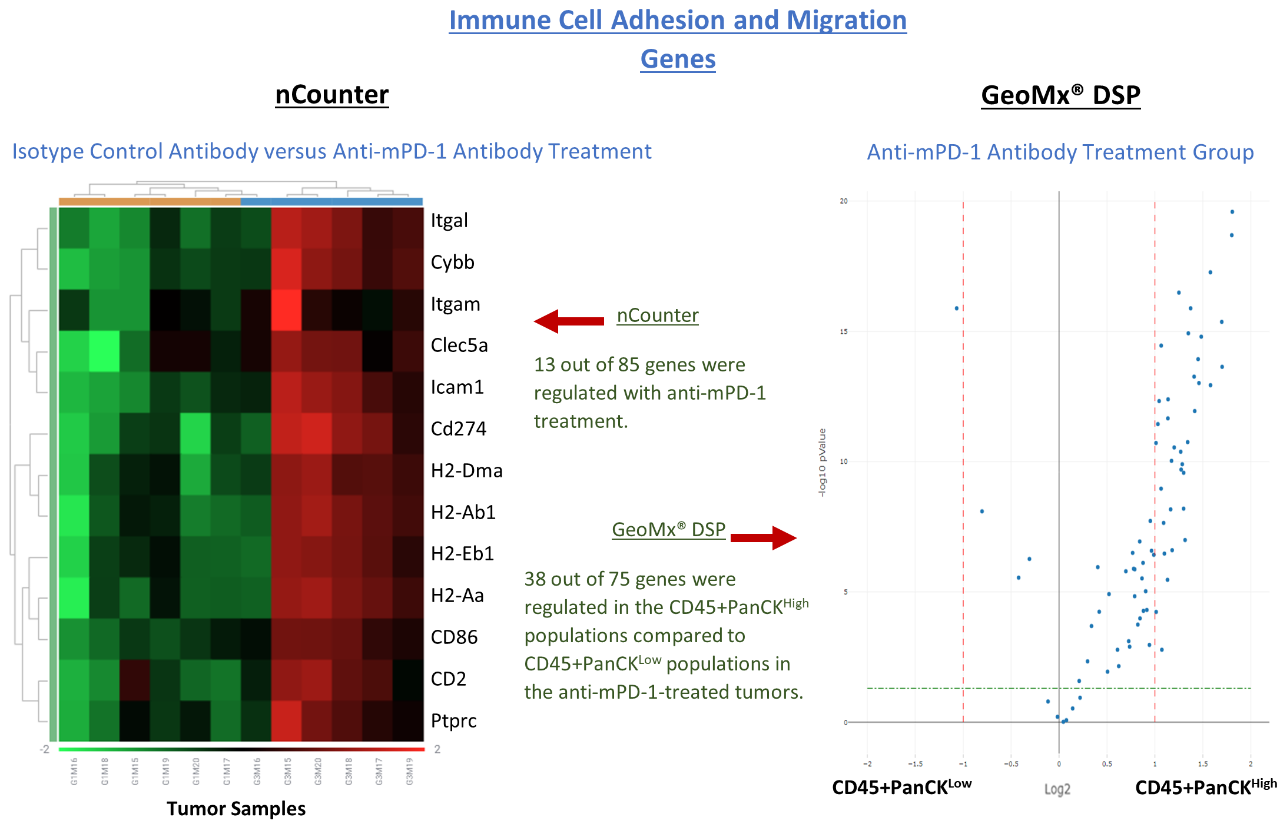
Figure 9. Transcriptomic modulation of the immune cell adhesion and migration genes that passed QC. On the left: Heatmap of whole tissue nCounter analysis comparing gene expression in isotype control antibody versus anti-mPD-1 antibody treated MC38-NCI.TD1 tumors. On the right: Volcano plot of GeoMx® DSP analysis comparing gene expression in CD45+PanCKHigh immune cells versus CD45+PanCKLow immune cells in anti-mPD-1 antibody treated MC38-NCI.TD1 tumors. Regulated genes only include significant genes (p ≤ 0.5) that showed ≥ 2-fold change.
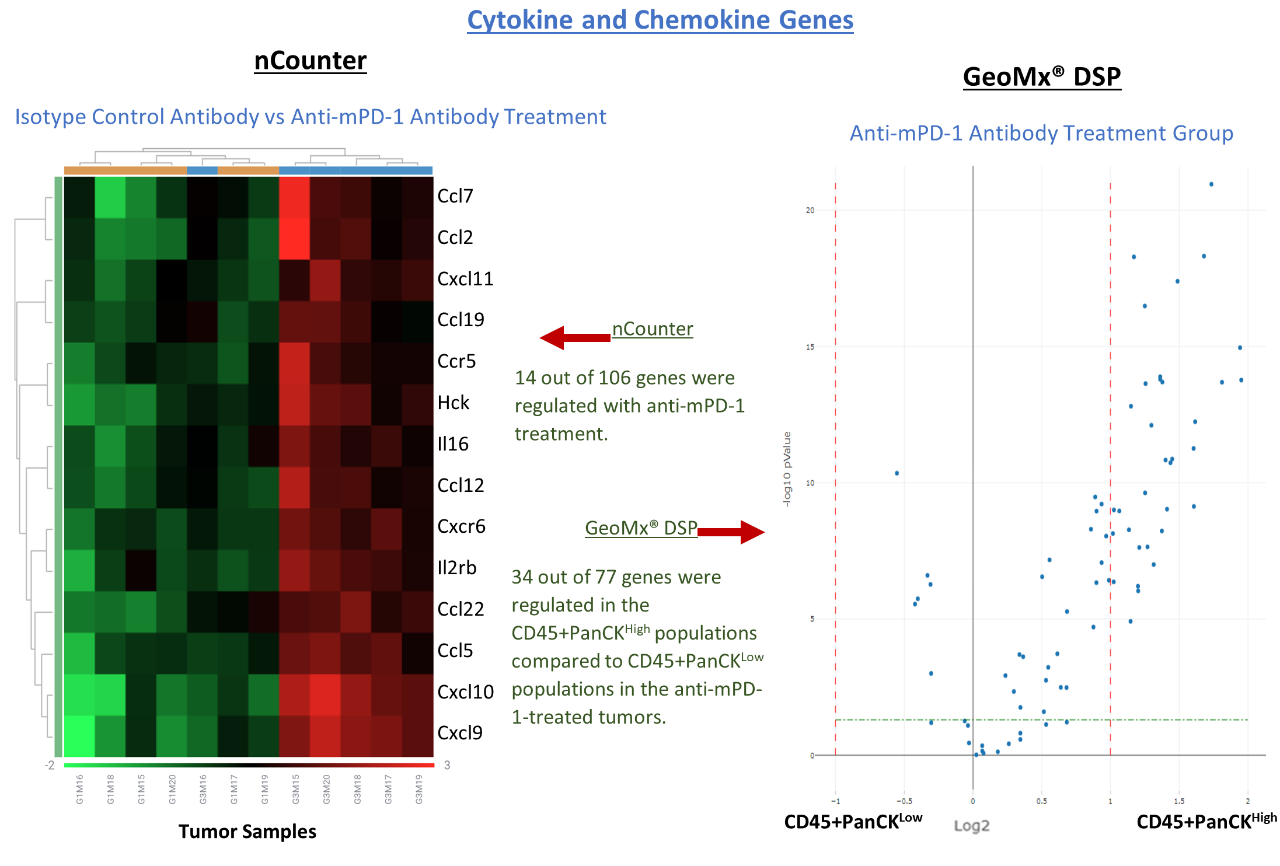
Figure 10. Transcriptomic modulation of the cytokine and chemokine genes that passed QC. On the left: Heatmap of whole tissue nCounter analysis comparing gene expression in isotype control antibody versus anti-mPD-1 antibody treated MC38-NCI.TD1 tumors. On the right: Volcano plot of GeoMx® DSP analysis comparing gene expression in CD45+PanCKHigh immune cells versus CD45+PanCKLow immune cells in anti-mPD-1 antibody treated MC38-NCI.TD1 tumors. Regulated genes only include significant genes (p ≤ 0.5) that showed ≥ 2-fold change.
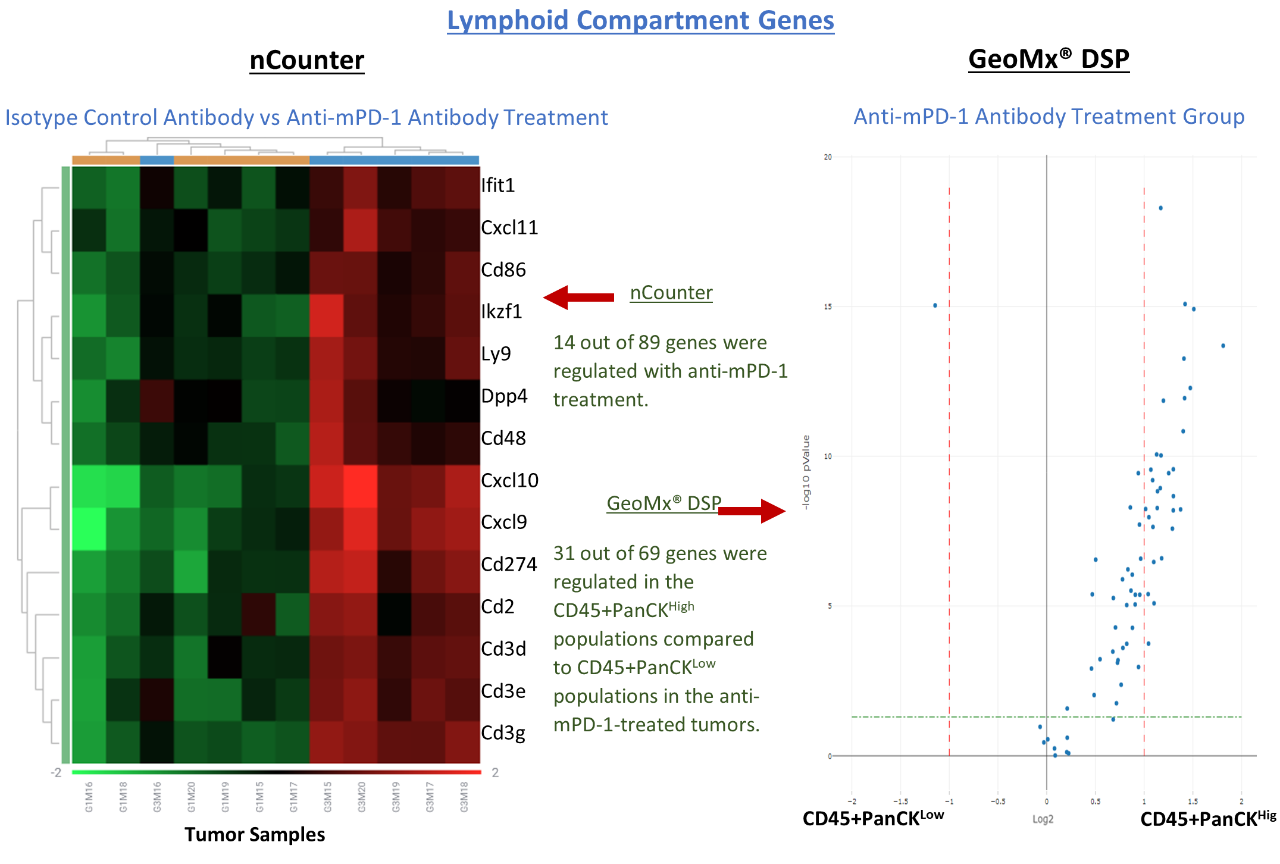
Figure 11. Transcriptomic modulation of the lymphoid compartment genes that passed QC. On the left: Heatmap of whole tissue nCounter analysis comparing gene expression in isotype control antibody versus anti-mPD-1 antibody treated MC38-NCI.TD1 tumors. On the right: Volcano plot of GeoMx® DSP analysis comparing gene expression in CD45+PanCKHigh immune cells versus CD45+PanCKLow immune cells in anti-mPD-1 antibody treated MC38-NCI.TD1 tumors. Regulated genes only include significant genes (p ≤ 0.5) that showed ≥ 2-fold change.
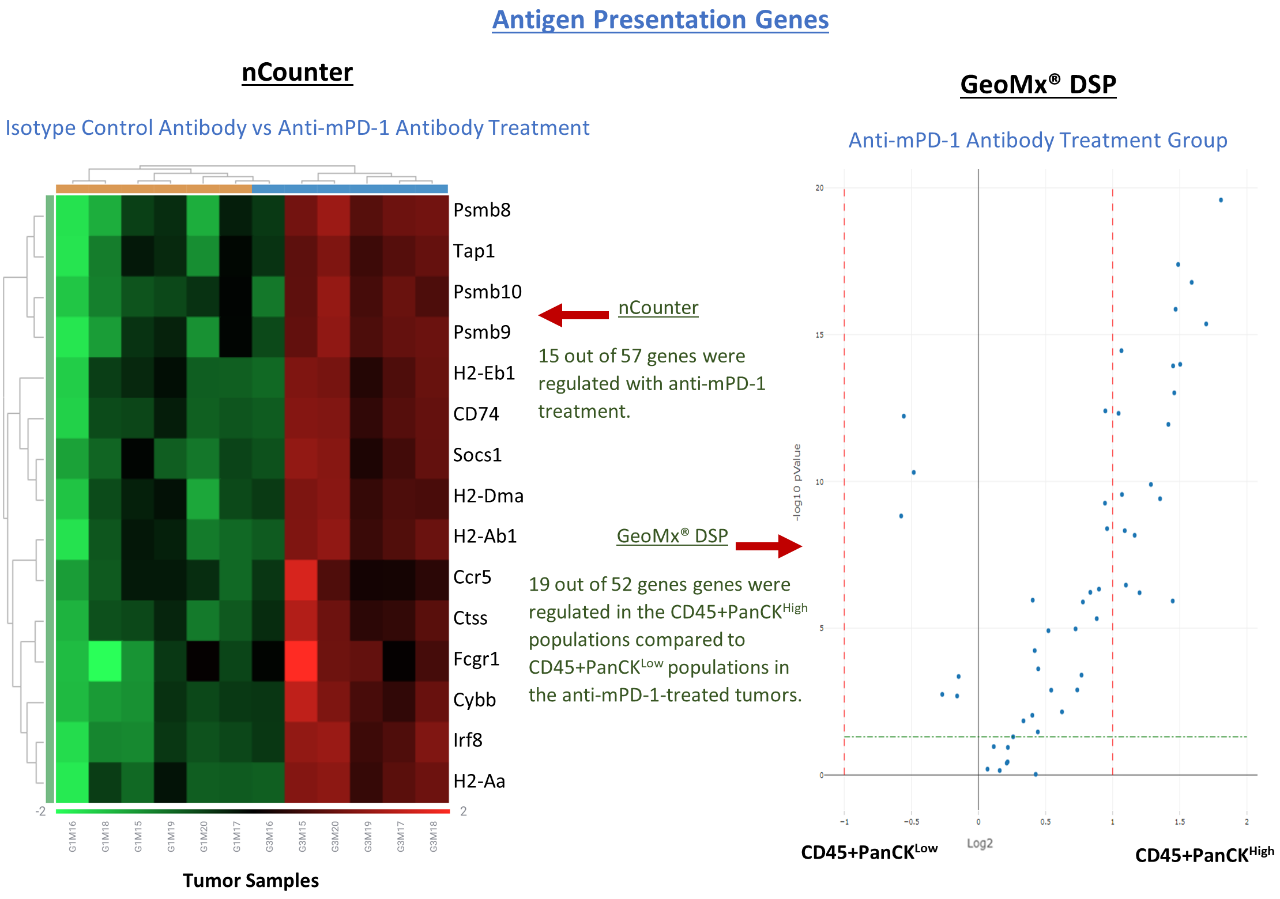
Figure 12. Transcriptomic modulation of the antigen presentation genes that passed QC. On the left: Heatmap of whole tissue nCounter analysis comparing gene expression in isotype control antibody versus anti-mPD-1 antibody treated MC38-NCI.TD1 tumors. On the right: Volcano plot of GeoMx® DSP analysis comparing gene expression in CD45+PanCKHigh immune cells versus CD45+PanCKLow immune cells in anti-mPD-1 antibody treated MC38-NCI.TD1 tumors. Regulated genes only include significant genes (p ≤ 0.5) that showed ≥ 2-fold change.
Biomarker analysis using GeoMx® DSP (RNA) versus flow cytometry (protein) revealed nuanced differences in specific genes regulated in immune cells from different compartments, CD45+PanCKHigh and CD45+PanCKLow cells; these differences go undetected or get diluted when using flow cytometry.
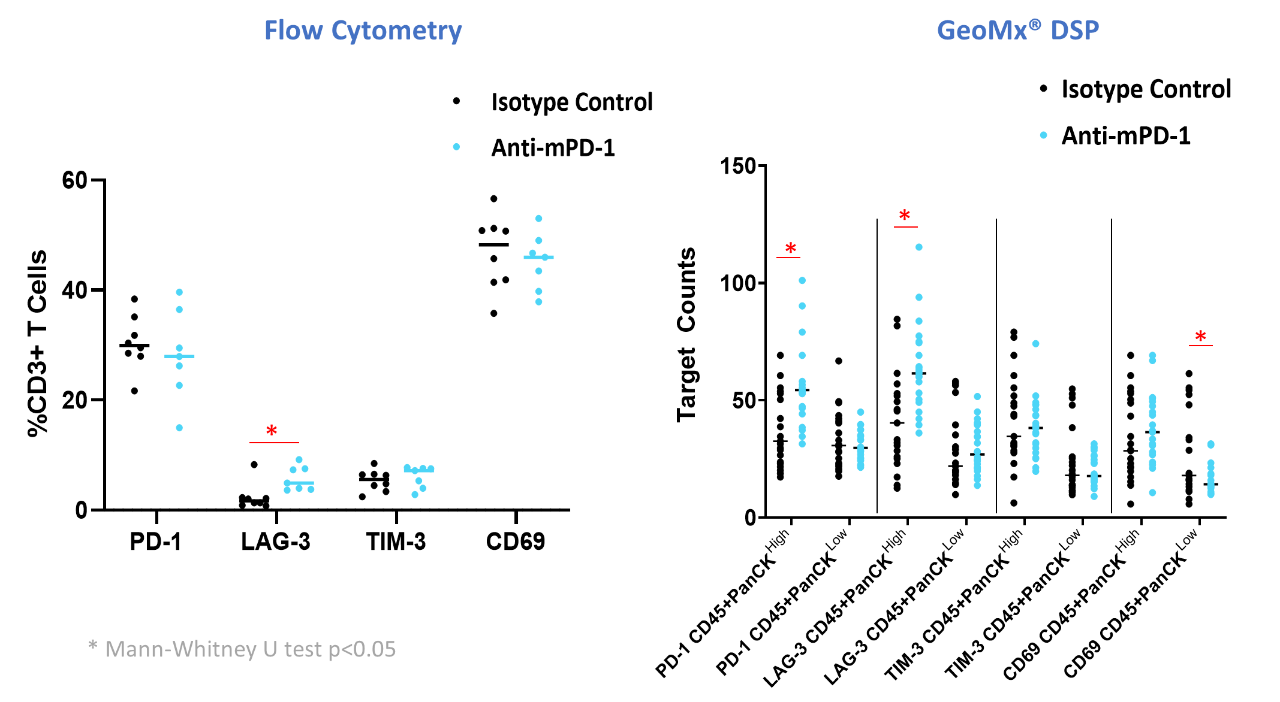
Figure 13. On the left: Flow cytometry showing gene expression in CD3+ T cells of isotype control versus anti-mPD-1 antibody treated MC38-NCI.TD1 SC tumors. On the right: GeoMx® DSP showing gene expression in CD45+PanCKHigh and CD45+PanCKLow immune cells of isotype control versus anti-mPD-1 antibody treated MC38-NCI.TD1 SC tumors. Horizontal black bars on the graphs represent median values. Changes found to be significant using the Mann-Whitney U test have been marked with *.
Overall, GeoMx® DSP represents a transformative stride in genomics research, enhancing our understanding of biological systems and surpassing the limitations of conventional bulk RNA analysis with a more comprehensive approach. Using GeoMx® DSP, biomarkers, pathway-specific genes, cell-type specific genes, activation/exhaustion markers or any set of genes-of-interest can be identified and analyzed in specific cell types, tissues, components or compartments of the TME.
Discover those fundamental gene expression changes using the GeoMx® Digital Spatial Profiler with Labcorp.
Connect
Let's start a conversation
Contact Us
Labcorp is a leading global life sciences company that includes contract research and developmental services to the pharmaceutical, medical technology, crop protection and chemical industries.